
Regex DebuggerWatch every step your pattern takes — and every step it takes back.
Testers tell you what a regex matches. A debugger tells you why — and where it burns time. This one instruments a backtracking engine, records every node attempt, give-back and capture into a typed-array event log, and lets you scrub through it like a video: a zoomable execution graph, per-node hot spots, capture withdrawal counts, catastrophic-backtracking detection, and one-click rewrites that are verified against the real engine before you apply them. Free, no account, no paywall.
Why a debugger, not just a tester?
Every regex tester shows the same three things: matches, groups, and an explanation of the pattern. That covers the happy path. It stops helping the moment a regex is almost right — matching one tag too many, missing a case you can't reproduce, or taking 400 ms on an input that looks identical to the one that took 4.
The failure modes of a backtracking engine are invisible from the outside. A pattern doesn't slowly get slower — it tries a prefix, gives characters back, retries the inner quantifier at a different split, fails, and repeats that a few thousand times. The match result looks the same as the fast version's. Only the trace of what the engine actually did tells them apart.
So the tester now ships with a full debugger. Not a slideshow of the final match — a complete, scrubbable recording of the engine's decision-making, from the first character to the last give-back.
A 60-second tour
The entry point is the Debug button on the tester toolbar — next to the flavor selector, right where you're already working. There's also a deep link at /debug that opens the tester with the debugger ready, so you can bookmark it or send a scenario to a teammate.

Hit it, and the debugger opens with the trace already recorded. The demo below uses the pattern <([a-z]+)([^<]+)*(?:>(.*)<\/\1>|\s+\/>) against <div>Content</div> — a benign-looking tag matcher whose nested quantifier generates 7,530 execution steps for 18 characters of input. That gap between “looks simple” and “7,530 steps” is exactly what the debugger makes visible.
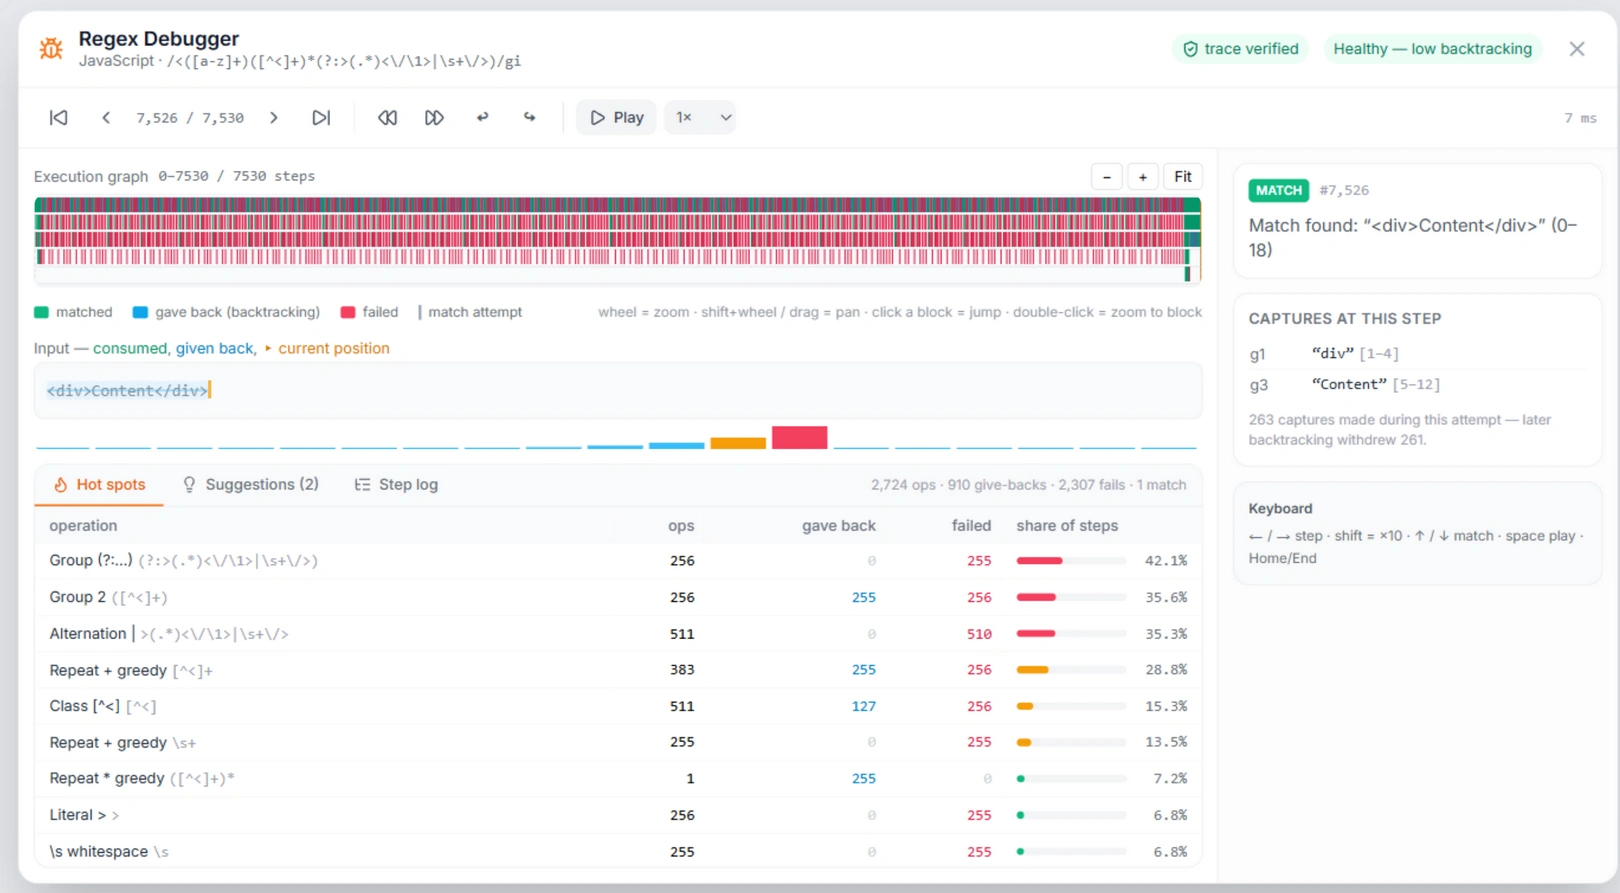
Everything you need is on one screen. The header carries a trace verified badge (more on that below) and a verdict chip — here Healthy — low backtracking. Below it: playback controls and a step counter, the execution graph, the input row with per-position heat bars, the Hot spots table, and a step inspector that follows your selection. No tabs to hunt through, no server round-trips.
The execution graph
The graph is the debugger's centerpiece: a flame-chart of the engine's work. Each bar is one node attempt — a TRY that ended in OK (green), FAIL (red), or was undone by backtracking (thin blue give-back marks). Rows are stack depth; vertical bands separate match attempts. When the engine backtracks, you see it — literally — as the bar it unwinds.

On a 7,530-step trace the overview is dense, so the graph behaves like a proper profiler view: scroll-wheel zoom, drag to pan, double-click to zoom to a block, and Fit to snap back. Click any block to jump the selection there — the amber marker follows, and every other panel (input row, inspector, hot-spot highlight) updates in lockstep. The range label always tells you which slice of the trace you're looking at.
A healthy trace reads as a calm staircase. A sick one shows the signature immediately: one region of the graph orders of magnitude wider than everything else, striped with red and blue. You don't need to read numbers to spot the quadratic or exponential wall — it's the part of the picture that looks wrong.
Stepping, captures & give-backs
You can also work the trace like a classic debugger. The toolbar steps one event at a time (←/→, shift for ×10), jumps between matches (↑/↓), hops to the next failure or the next give-back, and plays the whole match at 0.5×–6× speed. Everything is keyboard-driven — no pixel-hunting for buttons while you're thinking.
The inspector follows the selection. On a match step it shows the captured groups with their spans, plus a number most tools never surface: how many captures were made during the attempt, and how many of them backtracking later withdrew.
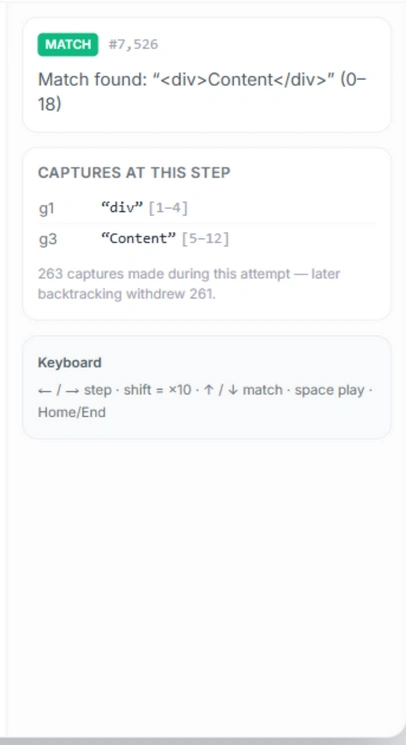
That “263 made, 261 withdrawn” line is the whole story of a backtracking engine in one sentence: the engine did 263 units of capture work and threw away 261 of them. On a healthy pattern those numbers are small. When they diverge, the input row shows you exactly which characters were consumed and then given back:

The heat bars under each character accumulate how often the engine touched that position — cool blue for once, hot red for hundreds of times. A quick scan of the heat row tells you whether the engine is doing linear work or re-chewing the same characters.
Hot spots: where the steps go
The Hot spots table is the profiler summary of the trace: every node of your pattern, ranked, with its operation count, give-backs, failures, and share of total steps.
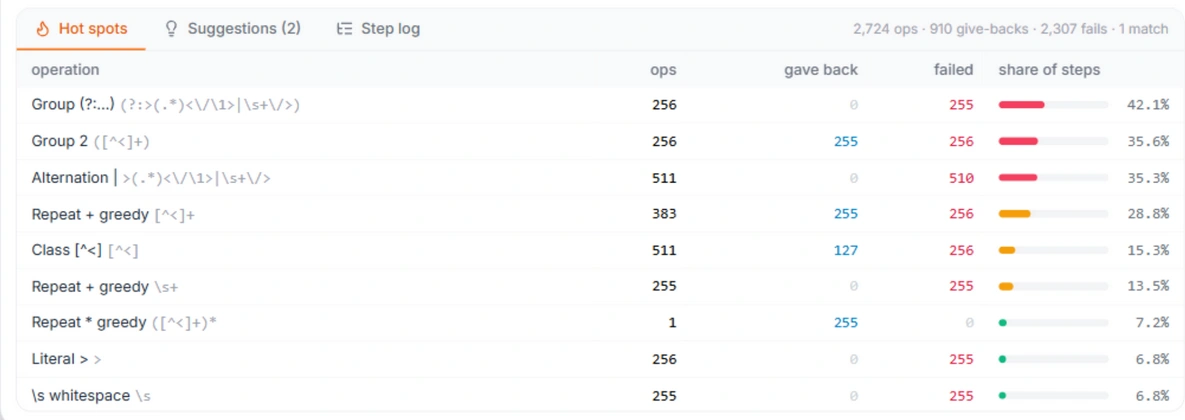
Reading it takes seconds: the top row is your problem. In the demo, the group (?:…) wrapping the alternation accounts for 42.1% of steps, with the inner ([^<]+) repeat right behind it at 35.6% — and the give-back column shows which of them keeps unspooling its work. That matches intuition (the nested quantifier re-splits the tag text for every outer retry), but now it's a measurement, not a guess. A show in execution graph link jumps from any row straight to the region of the graph where that node works, and a Step log tab lists raw events for when you want the unfiltered stream.
This is the same workflow you'd use on slow code: profile, find the hot function, fix, re-profile. It just didn't exist for regular expressions in a browser before.
From diagnosis to fix in two clicks
Diagnosis without a fix is only half a tool. The Suggestions panel combines static analysis of the pattern with statistics from the trace to propose concrete rewrites — dialect-aware, so a PCRE2 pattern gets atomic groups and possessive quantifiers while a JavaScript pattern gets the constructs ES2025 actually supports.
The classic case: (a+)+b — the textbook catastrophic backtracking example. On ten a's and a X, the trace explodes past its 50,000-event budget (itself a verdict), having already burned 8,192 failures. The debugger names the disease and prescribes the cure:
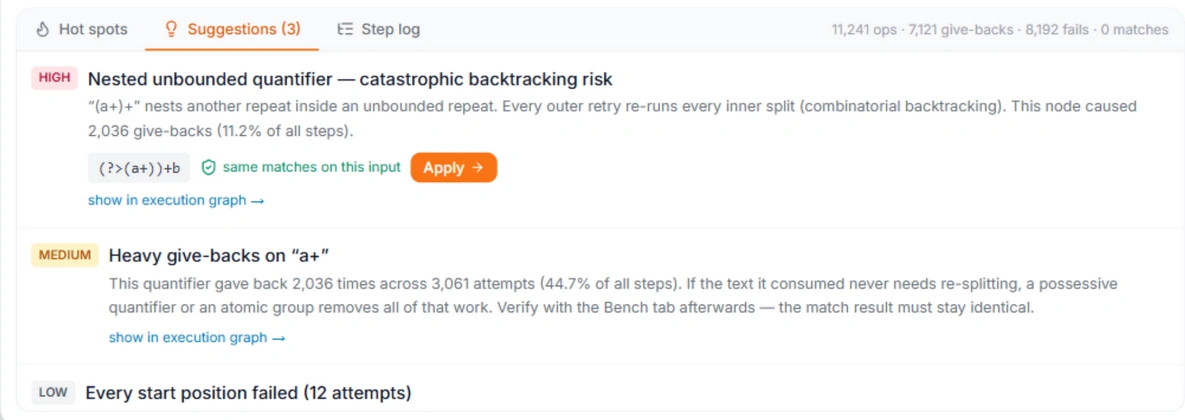
Two things make this safe to trust. First, the rewrite is checked for equivalence — both patterns are executed against the real engine for your dialect on your input, and only when the match lists agree does the same matches on this input badge appear. A faster regex that matches less is a bug, not an optimization, and it gets flagged here. Second, Apply writes the rewrite into the tester and re-traces immediately, so you see the after-picture without retyping anything:

From “this regex times out” to “here is the nested quantifier, here is a verified equivalent rewrite, here is the Healthy trace after applying it” — in about a minute, entirely in the browser.
Under the hood: a tracer kept honest
The trace comes from an instrumented backtracking engine — a continuation-passing matcher written for this purpose, speaking the semantics of nine flavor dialects (JavaScript, PCRE2, PCRE, .NET, Python, Java, Go, Rust and the formal-automata flavor). As it matches, it writes typed-array logs: one event stream (TRY, OK, FAIL, BACK), one frame index, one capture log, one per-node histogram. Typed arrays keep a 2-million-event budget affordable in a tab.
An instrumented engine is only useful if you can trust it, so every trace is cross-checked against the real thing: the match outcome is compared with the actual engine for the selected flavor — native RegExp for JavaScript, or the PCRE2 and .NET builds compiled to WebAssembly that the tester itself uses for matching. When they agree, the header shows the trace verified badge. Disagreement would be a bug in the tracer, and it's treated as one.
Guard rails keep the debugger from ever becoming the pathology it diagnoses: traces start at a 50,000-event budget, inputs are capped at 5,000 characters, and exploding patterns are marked truncated with a Record more control that raises the ceiling step by step to 2,000,000. A truncated trace is not a dead end — it's evidence.
How it compares
Step-through regex debuggers exist — usually as a linear event list, usually for a single flavor, and usually behind a paid subscription. This one was built against that bar:
| Capability | Typical regex debuggers | This regex debugger |
|---|---|---|
| Visualization | A linear list of steps you scroll through | Zoomable flame graph of the whole trace — pan, zoom to block, click to jump |
| Where the time goes | Your own reading of the step list | Hot spots table ranking every node by ops, give-backs, failures and share of steps |
| Backtracking visibility | Implied by the step sequence | Give-back marks in the graph, withdrawn-capture counts, consumed-vs-given-back input coloring with heat bars |
| Fix suggestions | None — you get to rewrite it yourself | Dialect-aware rewrites (atomic groups, possessive quantifiers) with severity ratings |
| Rewrite safety | n/a | Equivalence check against the real engine before you apply — "same matches on this input" or a warning |
| Trace correctness | Assumed | Every trace cross-checked against the actual PCRE2 / .NET / native-JS engine; "trace verified" badge |
| Flavors | Usually one | 9 dialects traced with flavor-accurate semantics and gated suggestions |
| Scaling to explosions | Hangs, or forces tiny inputs | 50k default event budget, expandable to 2M, truncation shown as evidence |
| Keyboard workflow | Buttons only | Full keyboard model: step ×10, match/failure/give-back jumps, playback, Home/End |
| Privacy | Patterns uploaded to a server | Everything runs locally — nothing leaves your browser |
| Price | Commonly a Pro-subscription feature | Free, no account |
Also in the box: attempt-separator bands in the graph, a raw Step log tab, playback at 0.5×–6×, and the /debug deep link.
FAQ
Does the debugger send my patterns anywhere?›
No. Tracing, verification and suggestions all run locally in your browser — the instrumented engine is plain JavaScript and the reference engines are WebAssembly builds of PCRE2/.NET plus native RegExp. Nothing is uploaded, ever.
Is the trace what a real engine does, or an approximation?›
It’s a faithful re-implementation of the flavor’s backtracking semantics — and it’s audited: after every trace, the match outcome is compared with the actual engine for that flavor, and the "trace verified" badge only appears when they agree. If they ever disagreed, that would be a bug to fix, not a heuristic to tune.
What happens with truly catastrophic patterns?›
The tracer runs under an event budget (50,000 by default). A pattern that blows through it is marked truncated — the truncation itself is diagnostic — and Record more raises the budget in steps up to 2,000,000 events so you can watch the explosion grow.
Can I trust the suggested rewrites?›
Check, then trust. Each rewrite is executed alongside your original on your exact input using the real engine for your dialect; only identical match lists earn the "same matches on this input" badge. If the check can’t run (say, the pattern is too explosive), the badge is withheld rather than guessed.
Which parts of the trace can I navigate by keyboard?›
←/→ step (⇧ for ×10), ↑/↓ jump between matches, dedicated jumps for the next/previous failure and give-back, Space plays the match, Home/End bound the trace, Esc closes. The debugger is designed to be driven without a mouse.
Does it work for my flavor?›
Nine dialects are traced: JavaScript, PCRE2, PCRE, .NET, Python, Java, Go, Rust and the formal-automata flavor. Suggestions are gated per flavor — you’ll only be offered atomic groups or possessive quantifiers where the dialect actually supports them.
Your pattern already knows why it's slow
Open the debugger on any regex and press Play. Sixty seconds of stepping beats an hour of staring at the pattern — and if it's catastrophic, you'll have the fix applied before the coffee lands.
Open the Regex Debugger