
Benchmark Regex ExecutionTwo patterns, both correct — which one is faster?
A built-in benchmark suite that measures repeated regex executions in your browser and compares up to five alternative patterns under identical conditions — same input, same flags, same engine. It times the real execution path your app uses, resolves latencies below the browser clock's precision, and warns you when two patterns aren't actually equivalent. Free, no account, no paywall.
Why benchmark regexes at all?
Regular expressions are deceptively easy to write and deceptively easy to make slow. Two patterns that produce identical matches on every input you care about can differ in throughput by an order of magnitude — and the difference rarely shows up until the pattern runs against a 10 MB log file in production, a thousand times per request.
Classic examples: (a+)+b vs a+b on a non-matching subject (catastrophic backtracking), or [0-9] vs\d under Unicode mode (property-class lookup vs a plain range). The only honest way to know is to measure — repeatedly, under identical conditions, on a machine that behaves like the one running your code. That is exactly what the benchmark suite does, entirely client-side.
A 60-second tour
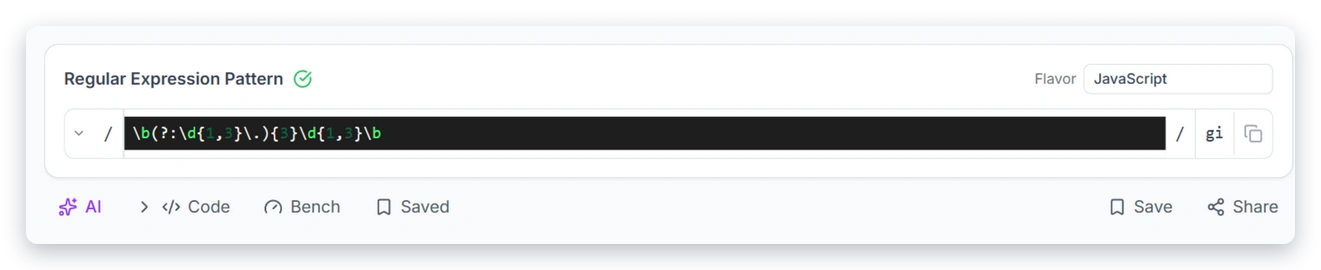
Pick your flavor, enter a pattern and a representative test string, then hit the Bench button in the toolbar:
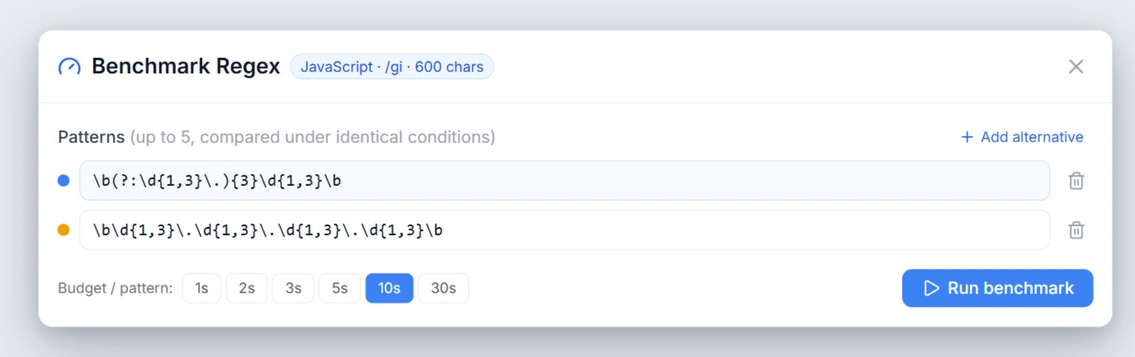
The benchmark panel opens with your current pattern pre-filled as pattern #1. Add up to four alternatives, choose a time budget per pattern (1 s to 30 s), and press Run benchmark:
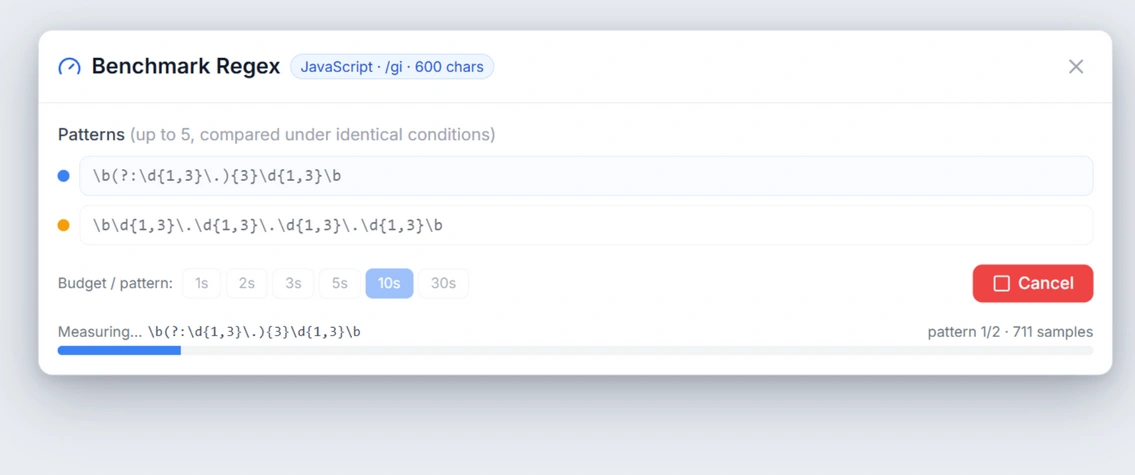
While the suite runs you get a live progress bar — which pattern is being measured, which phase it's in (engine load → verify → warmup → measuring), and how many samples have been collected. Cancel stops the run at any moment, and — unlike most tools — the results already collected are kept and shown.
Side-by-side pattern comparison
This is where the suite earns its keep. Most regex testers benchmark one pattern at a time — you note the number somewhere, tweak the pattern, re-run, and try to compare from memory. Here, alternatives run sequentially in one job, so the numbers are directly comparable, and the fastest pattern is crowned automatically with the exact speedup factor:
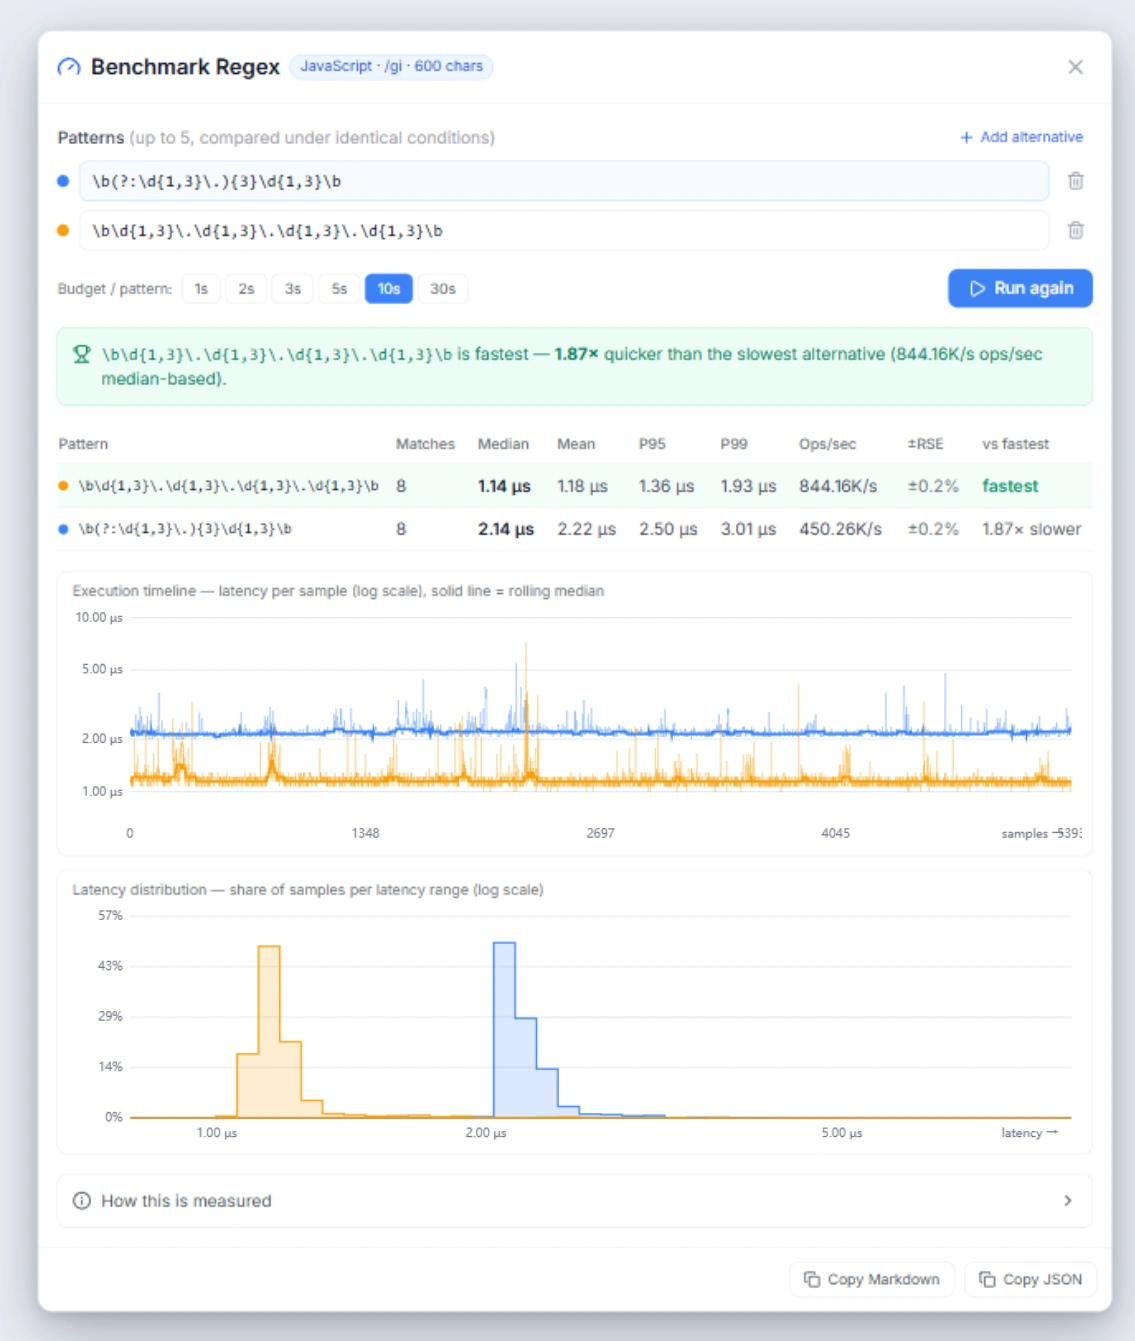
The table gives each pattern a row of honest statistics:
- Median (p50) — the typical execution time; robust against a few slow outliers, so it's the headline number and the basis of ranking.
- Mean — what throughput is actually computed from (ops/sec = 1/mean).
- P95 / P99 — tail latency. If your pipeline has SLAs, this is often the column that decides.
- ±RSE — the relative standard error of the mean, i.e. how much you should trust the mean given the sample count. Small is good; a large value says "re-run me".
- vs fastest — the multiplier against the winner, e.g. 6.2× slower.
- Matches — how many matches the pattern found. Remember this column; the next section explains why it can save you from a costly mistake.
The "faster because it matches less" trap
Here is a mistake every regex optimizer eventually makes: you tighten a pattern, the benchmark says it's 6× faster, you ship it — and later discover it silently matches fewer things. In the run below, pattern #2 looks like a clear winner… until you notice it found 3 matches instead of 8. It isn't faster at matching IPs; it simply matches a strict subset of them.
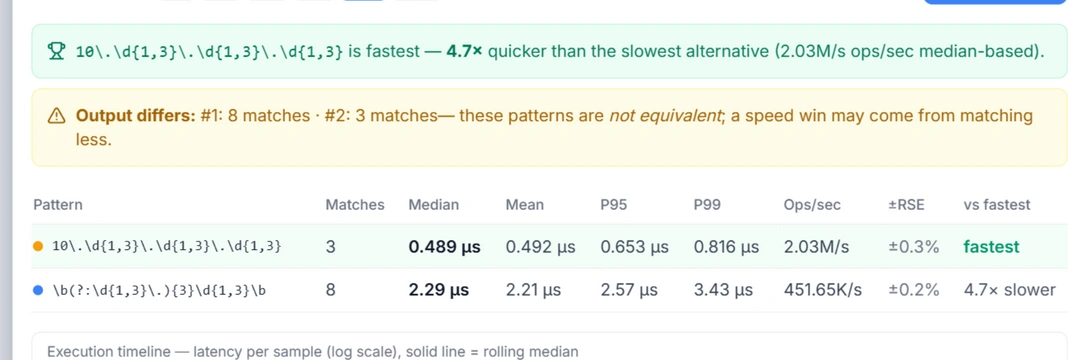
The suite compares match counts across patterns automatically and raises a warning the moment they diverge. A speed win over a pattern that doesn't produce the same output isn't a win — it's a bug you haven't noticed yet. Match and rejection inputs should be benchmarked separately; the guard makes that boundary visible instead of leaving it to your memory.
Reading the charts
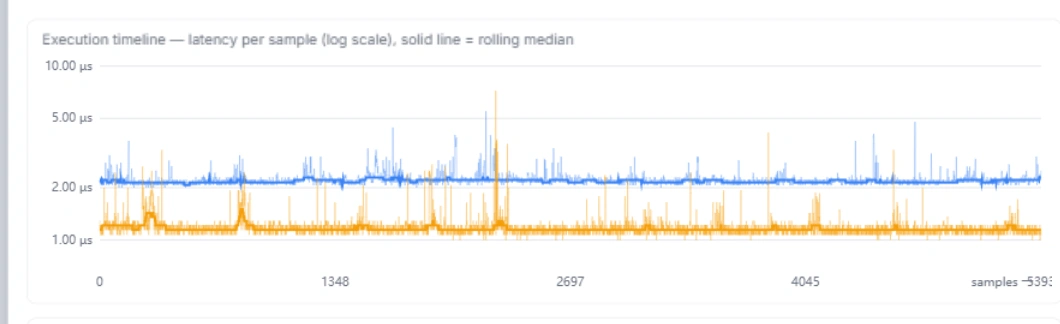
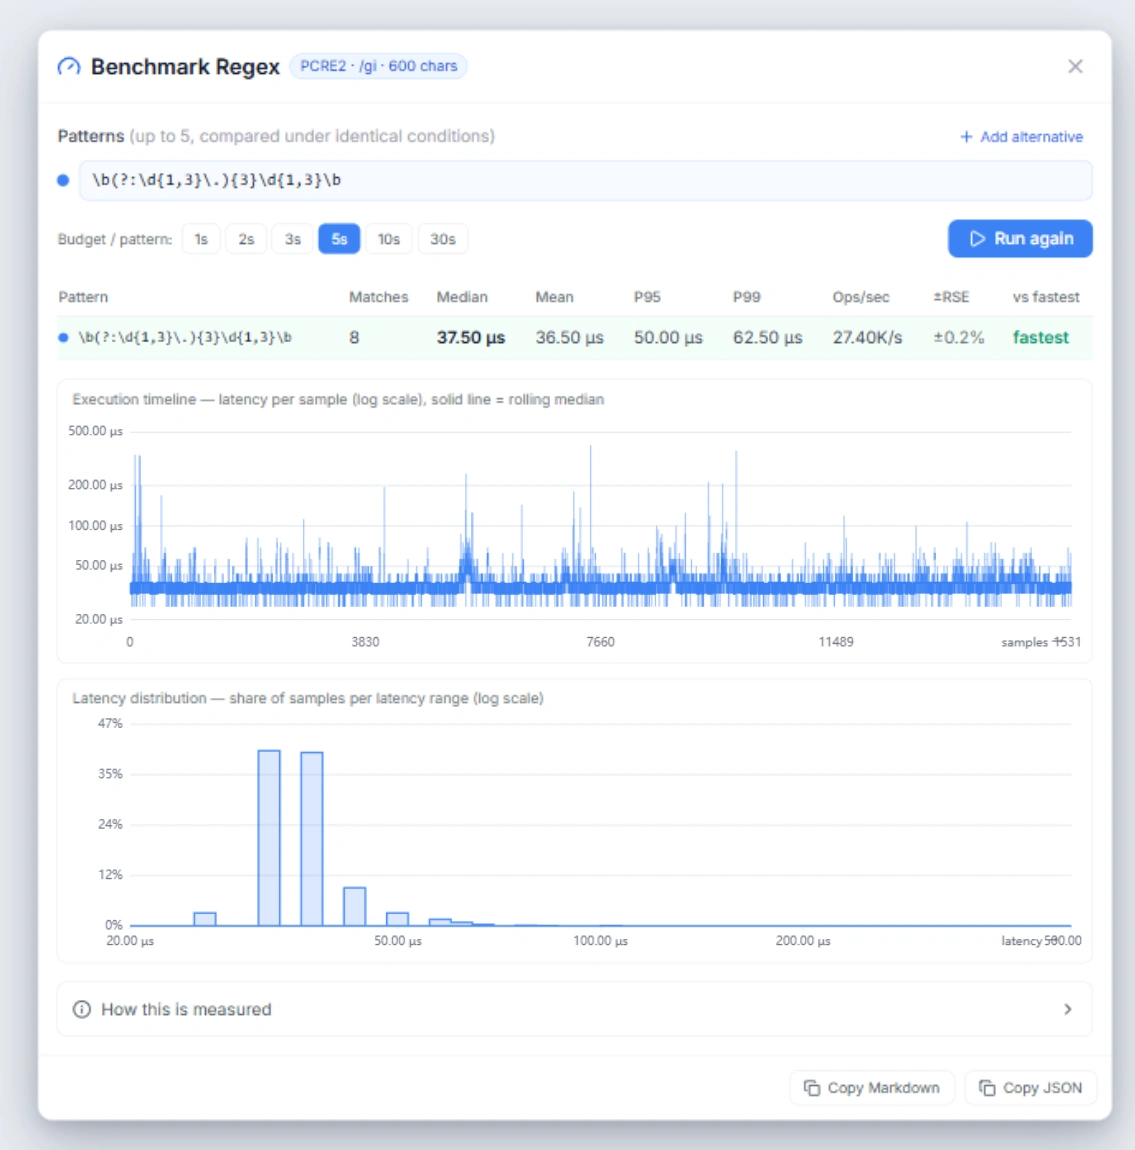
Two views help you see how the pattern behaves, not just how fast it is on average. The execution timeline plots every sample's latency across the run on a logarithmic axis — a 1 µs pattern and a 10 ms pattern can share one readable chart — with a solid rolling-median line per pattern to make trends obvious:
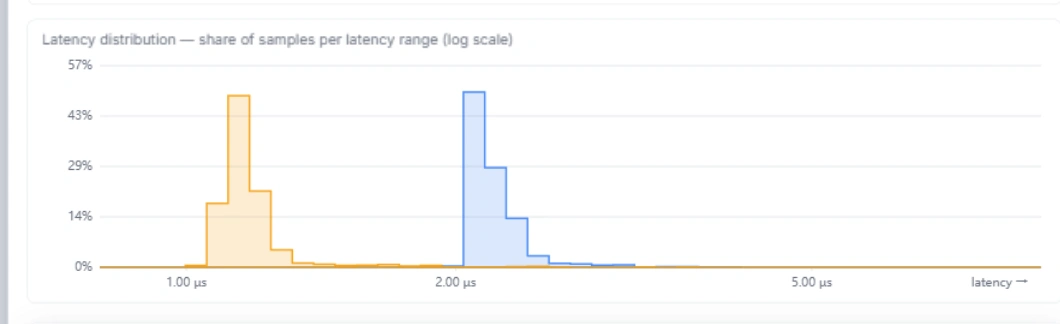
The latency distribution histogram shows where samples actually fall, with log-spaced bins and each series normalized to its own total — so shapes are comparable even when one pattern collected different sample counts. A tight single peak means predictable behavior; a long tail means GC pauses, tier-up transitions, or an engine that occasionally explores a slower path:
How the measurement works
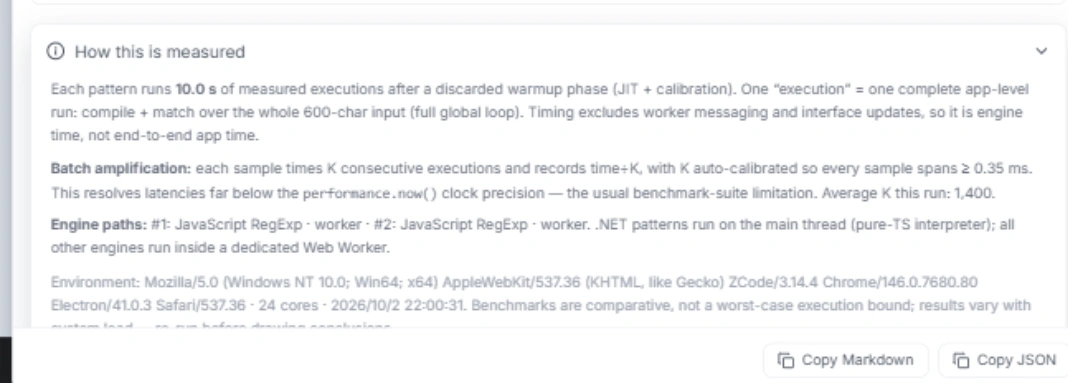
Expand "How this is measured" in the panel and the suite is fully transparent about its own methodology — warmup budget, amplification factor, engine paths, and an environment snapshot recorded with the run:
One execution = one real app run
A single "execution" is a complete run exactly as the editor performs it on every keystroke: compile + match over the whole input, including the full global loop when the g flag is set. Worker messaging and UI updates are excluded, so what you see is engine time, not interface overhead.
Batch amplification beats the clock
Browser clocks resolve to roughly a microsecond, which makes naive per-iteration timing meaningless for fast regexes — a documented limitation of several benchmark suites. This one sidesteps it: each sample times K consecutive executions and records time ÷ K, with Kauto-calibrated so every sample spans between 0.35 ms and 12 ms. The result: a 0.44 µs regex measures with sub-nanosecond effective resolution, and short budget runs still collect thousands of samples (a 1-second run above gathered ~2,700).
Real engines, real paths
The benchmark routes each pattern down the same execution path the tester itself uses — there is no separate "benchmark mode" that behaves differently:
- PCRE2 — the actual PCRE2 library compiled to WebAssembly, running in a dedicated worker.
- Go / Rust — the RE2-family automata engine (Rust regex crate) compiled to WASM: linear-time matching, no catastrophic backtracking.
- .NET — a faithful interpreter for System.Text.RegularExpressions semantics (balancing groups, conditionals, variable-length lookbehind).
- JavaScript, Python, Java and friends — the same normalize-to-JS path the editor executes per keystroke.
Warmup, honestly discarded
Every pattern first runs a warmup phase (JIT compilation + calibration) whose samples are thrown away — first-run outliers never pollute the statistics. The disclosure panel tells you exactly how many warmup iterations ran, the average amplification K, and the browser/CPU/timestamp of the run, because benchmark numbers without context are astrology.
Exporting & sharing results
One click copies the whole run as a Markdown table or structured JSON — pattern, engine path, match count, and every statistic — plus the environment snapshot (user agent, core count, timestamp). Paste it into a pull-request description, a ticket, or a performance log and the reader gets the full context:
## Regex Benchmark — PCRE2 (/g)
Input: 600 chars · 2026-10-02, 09:14 · Chrome/146 · 24 cores

| Pattern | Matches | Median | Mean | P95 | P99 | Ops/sec | RSE |
|---|---|---|---|---|---|---|---|
| #1 `\b(?:\d{1,3}\.){3}\d{1,3}\b` | 8 | 10.30 µs | 10.43 µs | 11.80 µs | 13.40 µs | 95.89K/s | ±0.2% |
How it compares
Benchmark suites exist in a few regex tools — typically single-pattern, sometimes behind a paid tier. This one was designed against that bar:
| Capability | Typical regex testers | This benchmark suite |
|---|---|---|
| Multi-pattern comparison | One pattern per run; you re-run and compare by hand | Up to 5 alternatives in one sequential, fair run — winner and speedup factors computed for you |
| Equivalence checking | None — output differences are your problem | Automatic match-count guard warns when patterns aren’t interchangeable |
| Clock precision | Per-iteration timing, floored by the µs-scale browser clock | Batch amplification: sub-ns effective resolution, thousands of samples per second |
| Engine fidelity | A single engine, or an approximation | The exact path the editor runs: PCRE2 / RE2 WASM, .NET interpreter, or normalized JS |
| Cancelling a run | Results discarded | Partial results kept and displayed |
| Export & environment log | Screenshot or nothing | Markdown + JSON with UA / cores / timestamp baked in |
| Price | Often locked behind a Pro subscription | Free, runs entirely in your browser |
Also in the box: live progress with phase reporting, per-pattern budgets from 1 s to 30 s, and dark-mode-native charts.
FAQ
Does the benchmark send my patterns anywhere?›
No. Timing happens inside your browser — JS in a Web Worker, PCRE2 and RE2 as WebAssembly, .NET via a TypeScript interpreter on the main thread. Nothing is uploaded.
Why does one execution include compilation?›
Because that mirrors real usage: most applications compile once and reuse, but testers, editors and many scripts recompile per call. The suite measures the complete app-level run and says so explicitly in its methodology panel — when you compare patterns against each other under identical rules, the comparison stays valid either way.
What do I do if a single execution exceeds 10 seconds?›
The suite refuses to benchmark it (with a clear message) — reduce the input to a minimal reproduction first. A run that slow is usually catastrophic backtracking, and the fix is the pattern, not the measurement.
How many samples are collected?›
It depends on the budget and the pattern speed: samples are calibrated to span 0.35–12 ms each, so a 10-second budget typically yields several thousand samples — enough for stable P95/P99 estimates. The ±RSE column tells you when it isn’t.
Are benchmark results a worst-case bound?›
No. Benchmarks are comparative measurements on one machine at one moment; they establish no upper bound for arbitrary inputs. Tail-latency percentiles (P95/P99) describe the observed distribution only.
Which flavors are supported?›
All of them. PCRE2, Go, Rust and .NET run on their dedicated engines; JavaScript runs natively; Python, Java and the rest run through the same normalization path the tester uses for matching.
Your next regex decision deserves data
Open the tester, type two alternatives, press Bench. Sixty seconds later you'll know which one to ship — and whether they really do the same thing.
Open the Benchmark Suite